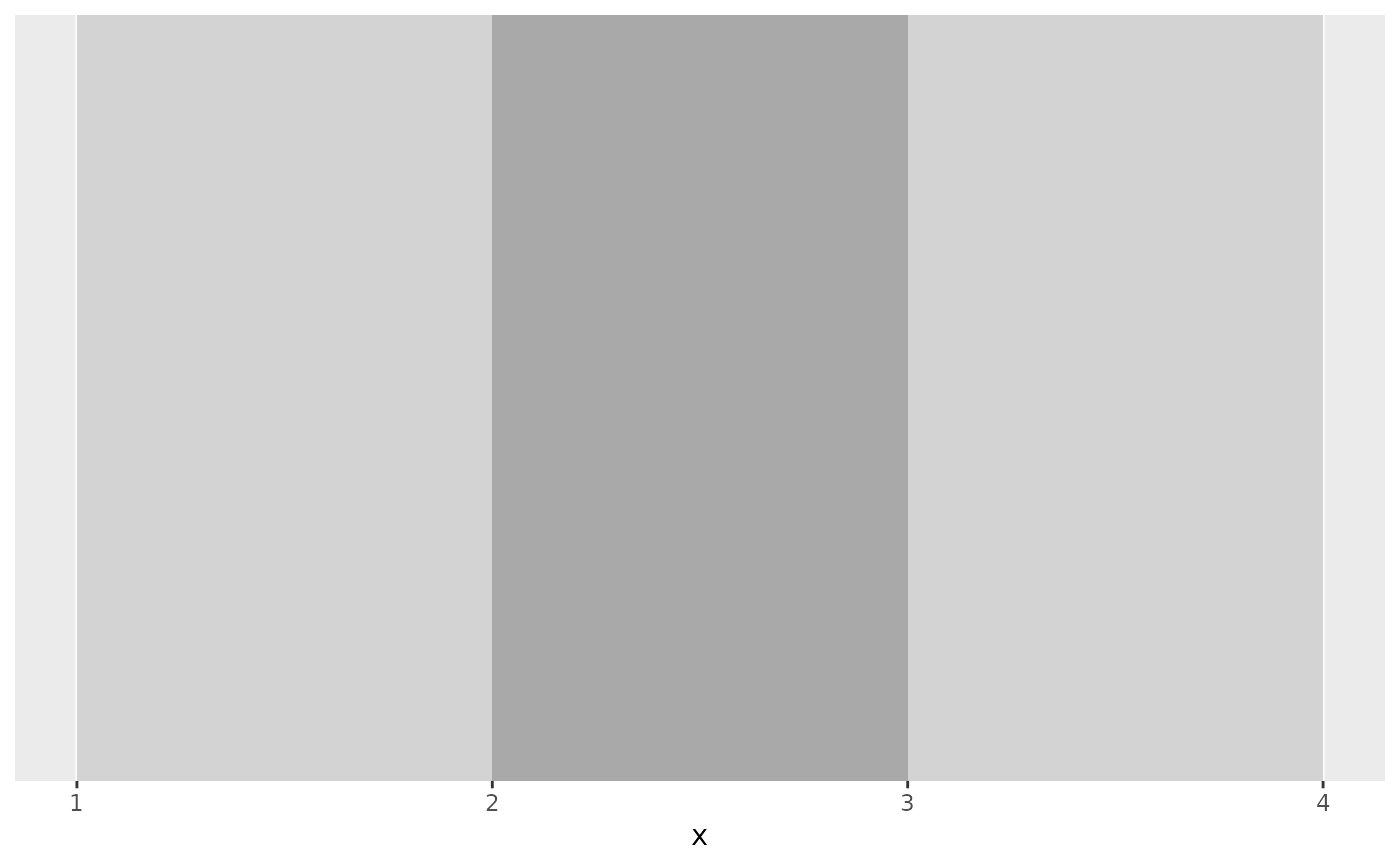
Vertical stripe with constant fill
geom_vstripe.RdDisplays a vertical stripe that spans the entire height of the plot for each pair of x and xend values. Optional alpha defaults to 1.
Usage
geom_vstripe(
  mapping = NULL,
  data = NULL,
  stat = "identity",
  position = "identity",
  ...,
  show.legend = NA,
  inherit.aes = FALSE
)
Arguments
- mapping
Set of aesthetic mappings created by
aes(). If specified andinherit.aes = TRUE(the default), it is combined with the default mapping at the top level of the plot. You must supply mapping if there is no plot mapping.- data
The data to be displayed in this layer.
- stat
The statistical transformation to use on the data for this layer.
- position
A position adjustment to use on the data for this layer.
- ...
Other arguments passed on to
layer()'s params argument.- show.legend
logical. Should this layer be included in the legends?
- inherit.aes
If
FALSE, overrides the default aesthetics, rather than combining with them.
Examples
stripes_df <- data.frame(x = c(1, 2, 3),
xend = c(2, 3, 4),
fill = c("lightgray", "darkgray", "lightgray"))
ggplot2::ggplot(stripes_df) + geom_vstripe(ggplot2::aes(x = x, xend = xend), fill = stripes_df$fill)
 #> x xend PANEL group alpha fill
#> 1 0.04545455 0.3484848 1 -1 1 lightgray
#> 2 0.34848485 0.6515152 1 -1 1 darkgray
#> 3 0.65151515 0.9545455 1 -1 1 lightgray
#> x xend PANEL group alpha fill
#> 1 0.04545455 0.3484848 1 -1 1 lightgray
#> 2 0.34848485 0.6515152 1 -1 1 darkgray
#> 3 0.65151515 0.9545455 1 -1 1 lightgray