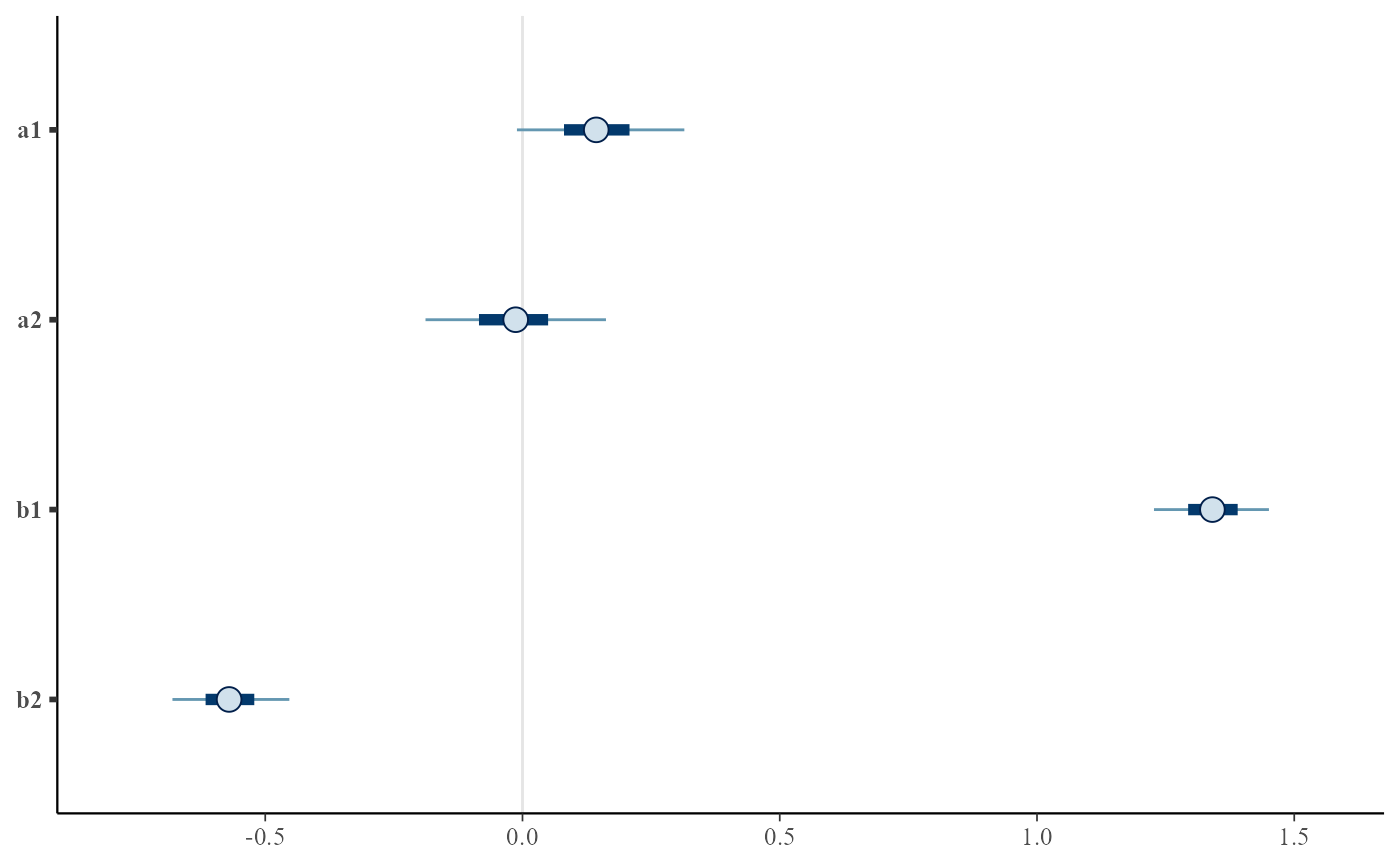
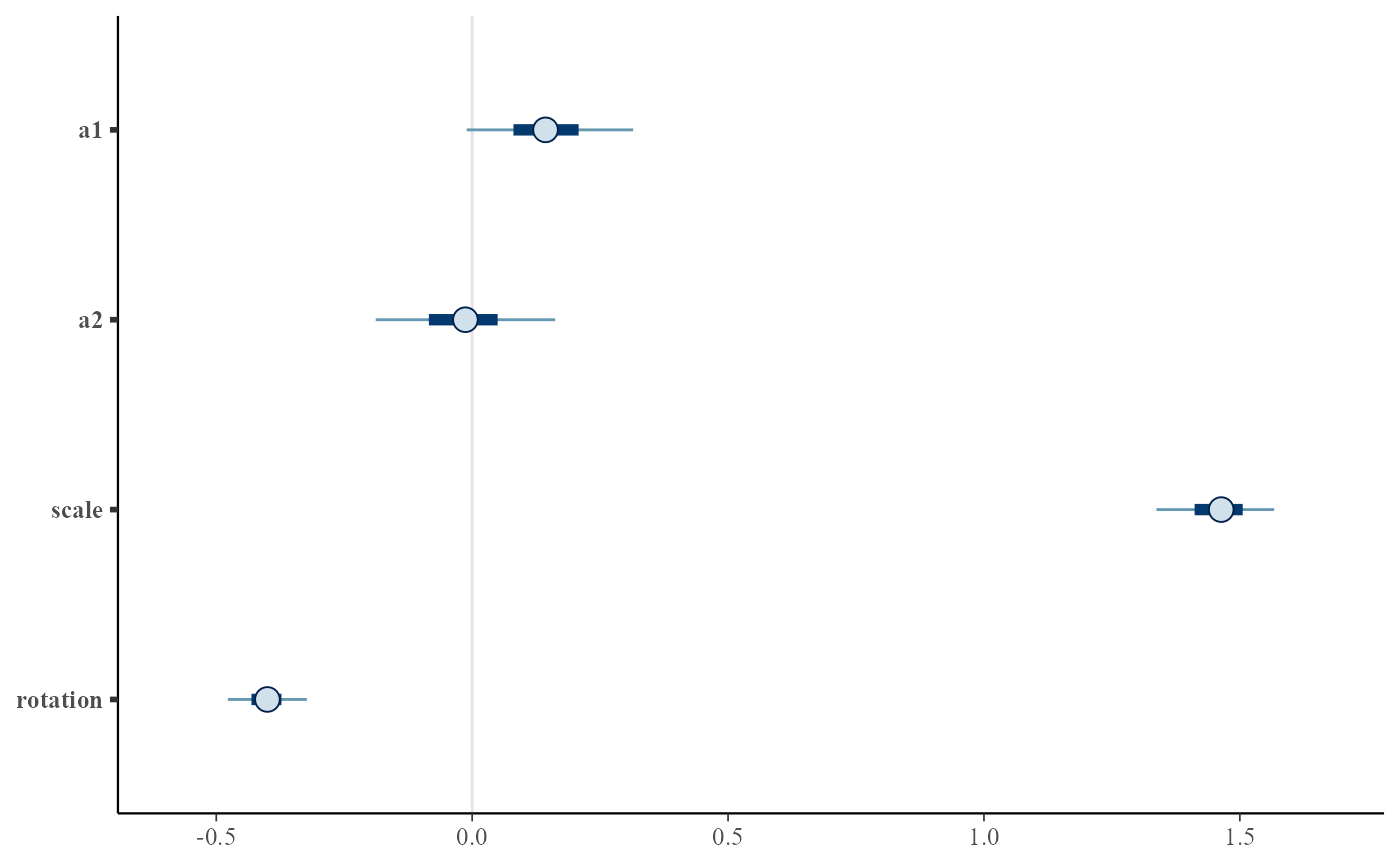
Posterior interval plots for key parameters. Uses bayesplot::mcmc_intervals.
Source:R/plot.R
plot.tridim_transformation.RdPosterior interval plots for key parameters. Uses bayesplot::mcmc_intervals.
Usage
# S3 method for tridim_transformation
plot(x, convert_euclidean = FALSE, ...)
Arguments
- x
A tridim_transformation object
- convert_euclidean
Whether to convert matrix coefficients to scale(phi) and rotation(theta). Defaults to
FALSE.- ...
Extra parameters to be passed to
bayesplot::mcmc_intervals()
Value
A ggplot object produced by bayesplot::mcmc_intervals()
Examples
euc2 <- fit_transformation(depV1+depV2~indepV1+indepV2,
                           data = NakayaData,
                           transformation = 'euclidean')
#>
#> SAMPLING FOR MODEL 'tridim_transformation' NOW (CHAIN 1).
#> Chain 1:
#> Chain 1: Gradient evaluation took 0 seconds
#> Chain 1: 1000 transitions using 10 leapfrog steps per transition would take 0 seconds.
#> Chain 1: Adjust your expectations accordingly!
#> Chain 1:
#> Chain 1:
#> Chain 1: Iteration:    1 / 2000 [  0%]  (Warmup)
#> Chain 1: Iteration:  200 / 2000 [ 10%]  (Warmup)
#> Chain 1: Iteration:  400 / 2000 [ 20%]  (Warmup)
#> Chain 1: Iteration:  600 / 2000 [ 30%]  (Warmup)
#> Chain 1: Iteration:  800 / 2000 [ 40%]  (Warmup)
#> Chain 1: Iteration: 1000 / 2000 [ 50%]  (Warmup)
#> Chain 1: Iteration: 1001 / 2000 [ 50%]  (Sampling)
#> Chain 1: Iteration: 1200 / 2000 [ 60%]  (Sampling)
#> Chain 1: Iteration: 1400 / 2000 [ 70%]  (Sampling)
#> Chain 1: Iteration: 1600 / 2000 [ 80%]  (Sampling)
#> Chain 1: Iteration: 1800 / 2000 [ 90%]  (Sampling)
#> Chain 1: Iteration: 2000 / 2000 [100%]  (Sampling)
#> Chain 1:
#> Chain 1:  Elapsed Time: 0.106 seconds (Warm-up)
#> Chain 1:                0.113 seconds (Sampling)
#> Chain 1:                0.219 seconds (Total)
#> Chain 1:
plot(euc2)


# same but for converted coefficients
plot(euc2, convert_euclidean=TRUE)
